← All Analyses NVDABullish
NVDAPrevious days highs and lows

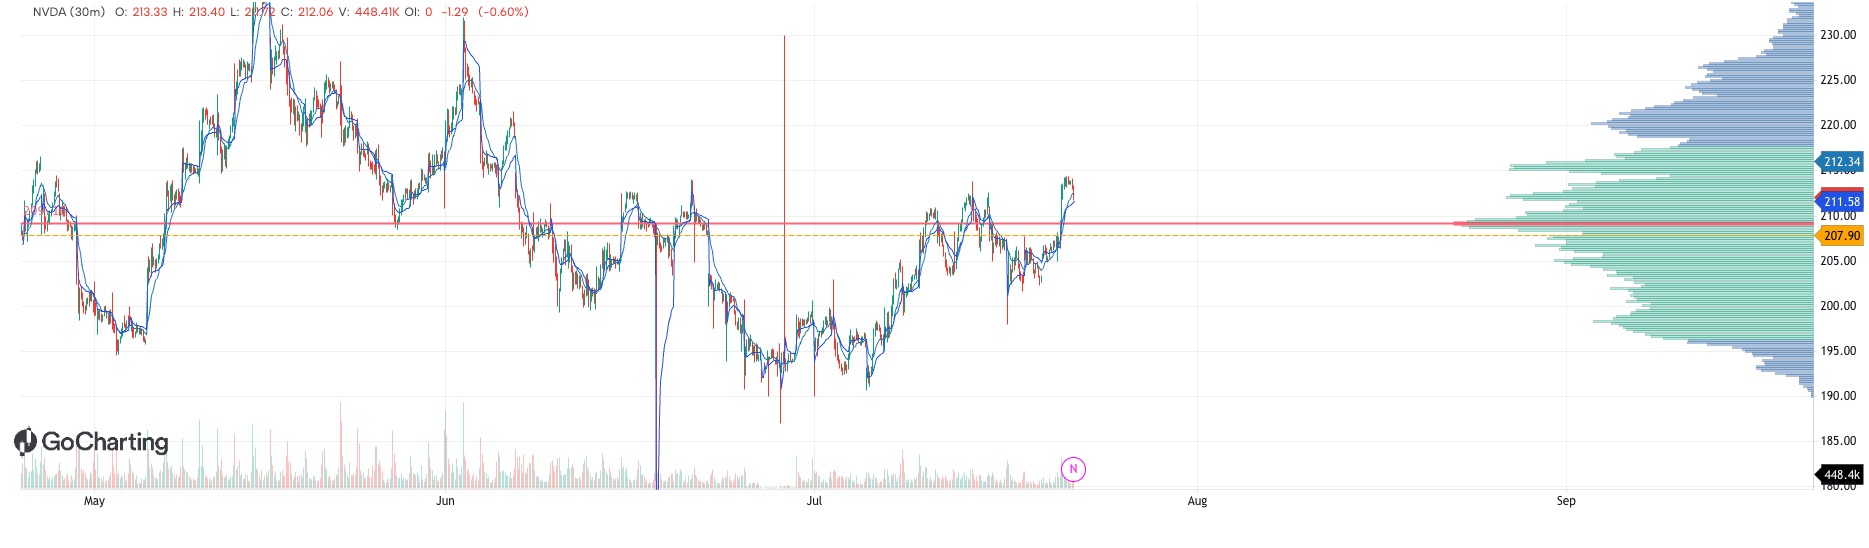
Map previous days highs and lows and suse it to make your trades better. You can analyze key liquidity levels and see if they match up with volume profile or delta.
Disclaimer
The information and publications are not meant to be, and do not constitute, financial, investment, trading, or other types of advice or recommendations supplied or endorsed by GoCharting. Read more in the Terms of Use.
Comments (0)
Loading comments…